

Forecasting
DemandCast
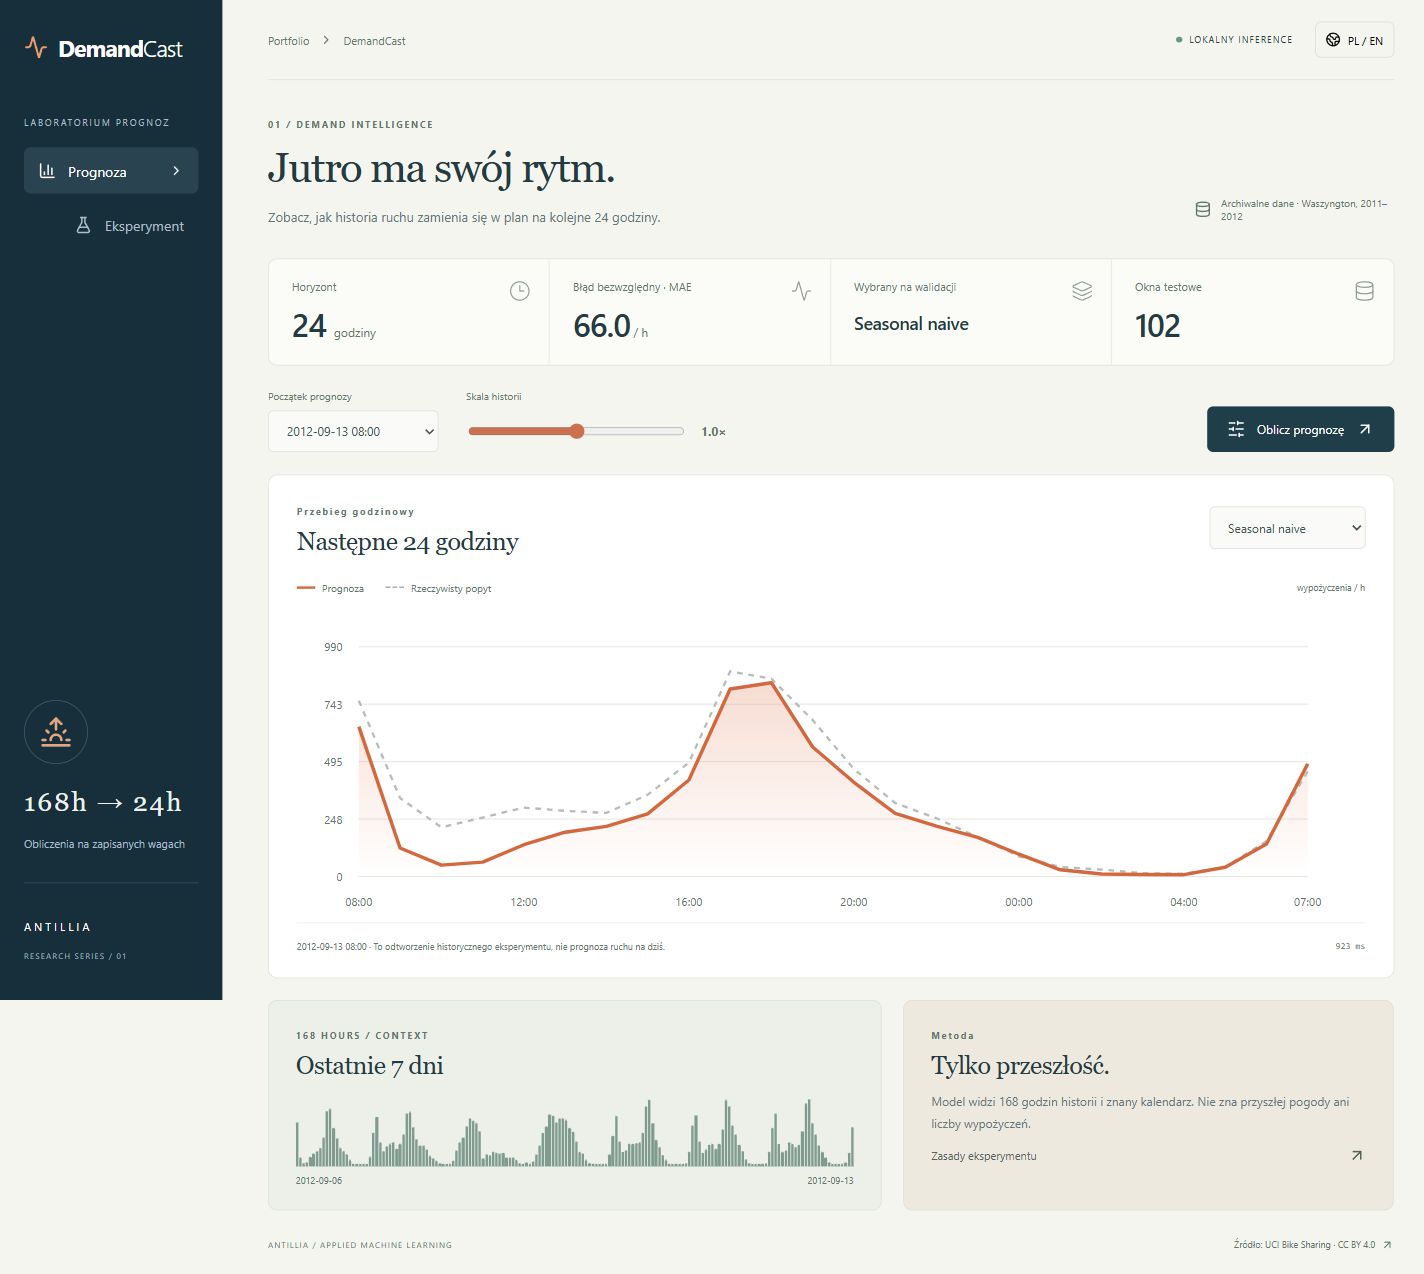
A 24-hour forecast compared with what actually happened.
Compare forecasts ↓
Recorded study · report data
Compare forecasts
Choose a period and method. The chart shows the recorded forecast and observed rentals for the following 24 hours.
Observed demandForecast
Loading recorded results…
View hourly values
| Hour | Forecast | Observed demand |
|---|
UCI Bike Sharing · CC BY 4.0. MAE is the mean absolute error for the selected period.
Download recorded forecasts ↓Study results
Explore recorded forecasts
- MAE · rentals / h
- 66.01
- Forecast horizon
- 24 h
Method
168 hours of history and known calendar features. The seasonal baseline beat boosting and GRU on validation.
- Input
- 168 hours of history
- Output
- 24 forecast hours
Limits of the result
One city, 2011–2012 data. This is a historical experiment, not a forecast of current demand.